BOOKS FOR YOU TO READ AND DOWNLOAD
- Lanuage In Science by
M. S. Thirumalai, Ph.D. - Vocabulary Education by
B. Mallikarjun, Ph.D. - A CONTRASTIVE ANALYSIS OF HINDI AND MALAYALAM by V. Geethakumary, Ph.D.
- LANGUAGE OF ADVERTISEMENTS IN TAMIL by Sandhya Nayak, Ph.D.
- An Introduction to TESOL: Methods of Teaching English to Speakers of Other Languages by M. S. Thirumalai, Ph.D.
- Transformation of Natural Language into Indexing Language: Kannada - A Case Study by B. A. Sharada, Ph.D.
- How to Learn Another Language? by M.S.Thirumalai, Ph.D.
- Verbal Communication with CP Children by Shyamala Chengappa, Ph.D. and M.S.Thirumalai, Ph.D.
- Bringing Order to Linguistic Diversity - Language Planning in the British Raj by
Ranjit Singh Rangila,
M. S. Thirumalai,
and B. Mallikarjun
REFERENCE MATERIAL
- Languages of India, Census of India 1991
- The Constitution of India: Provisions Relating to Languages
- The Official Languages Act, 1963 (As Amended 1967)
- Mother Tongues of India, According to 1961 Census of India
BACK ISSUES
- FROM MARCH 2001
- FROM JANUARY 2002
- INDEX OF ARTICLES FROM MARCH, 2001 - FEB. 2003
- INDEX OF AUTHORS AND THEIR ARTICLES FROM MARCH, 2001 - FEB. 2003
- E-mail your articles and book-length reports to thirumalai@bethfel.org or send your floppy disk (preferably in Microsoft Word) by regular mail to:
M. S. Thirumalai
6820 Auto Club Road #320
Bloomington, MN 55438 USA. - Contributors from South Asia may send their articles to
B. Mallikarjun,
Central Institute of Indian Languages,
Manasagangotri,
Mysore 570006, India or e-mail to mallikarjun@ciil.stpmy.soft.net - Your articles and booklength reports should be written following the MLA, LSA, or IJDL Stylesheet.
- The Editorial Board has the right to accept, reject, or suggest modifications to the articles submitted for publication, and to make suitable stylistic adjustments. High quality, academic integrity, ethics and morals are expected from the authors and discussants.
Copyright © 2001
M. S. Thirumalai
URDU IN UTTAR PRADESH AND UTTARANCHAL
A. R. Fatihi, Ph.D.
1. UTTAR PRADESH AND UTTARANCHAL
Area: 2,94,411 sq.km
Population: 1391.1 lakhs
Capital: Lucknow, Uttar Pradesh
Capital: Nainital, Uttaranchal
Principal Languages: Hindi, Urdu, and Pahari2. A BRIEF HISTORICAL, GEOGRAPHICAL, AND LINGUISTIC SKETCH OF THE STATE
Uttar Pradesh is an ancient land. It is recognized in the later Vedic Age as Brahmarshi Desha or Madhya Desha. It is surrounded by Tibet and Nepal in the north, Himachal Pradesh in the north-west, Haryana in the west, Madhya Pradesh in the south, and Bihar in the east. The British combined Agra and Oudh into a single province and called it United Provinces of Agra and Oudh. This was referred to as the United Provinces in 1935. In January 1950, the United Provinces was renamed as Uttar Pradesh. A separate hill state Uttaranchal was created on November 9, 2000 comprising Garhwal and Kumaon regions from out of the larger Uttar Pradesh.
Uttar Pradesh (including Uttaranchal) has a population of 13,91,12,287 persons. Hindi is the regional and official language of the State, which is spoken by 89.68 per cent of the population.
The speakers of Urdu (9.20%) and Bengali (0.14%) constitute the major linguistic minority groups of the State.
The speakers of minority languages that constitute less than 0.09 per cent are the speakers of Sindhi (0.04%), Gujarati (0.01%), Kannada (0.01%), Malayalam (0.01%), Marathi (0.01%), Oriya (0.01%), Tamil (0.01%), Telugu (0.01%), Tripuri (0.01%) and Gorkhali/Nepali (0.03%).
3. THE DISTRICTS OF UTTAR PRADESH AND UTTARANCHAL
Table 1 below gives a detailed account of the area, population, and the headquarters of the districts of Uttar Pradesh and Uttaranchal.
Table 1: Area, Population and Headquarters of Districts in Uttar Pradesh
| District | Area (sq km) | Population (Lacs) | Headquarters | Total Urdu Population (Lacs) | %age(Between 3 & 5) | Muslim Population (Lacs) | %age(Between 3 & 6) | %age(Between 5 & 6) |
| 1 | 2 | 3 | 4 | 5 | 6 | |||
| Agra | 4027 | 27.5 | Agra | 1.0 | 3.7 | 3.0 | 11.0 | 33.9 |
| Aligarh | 5019 | 33.0 | Aligarh | 2.5 | 7.6 | 4.8 | 14.6 | 52.2 |
| Allahabad | 2261 | 49.2 | Allahabad | 2.2 | 4.5 | 6.4 | 12.9 | 35.0 |
| Azamgarh | 4234 | 31.5 | Azamgarh | 2.9 | 9.0 | 4.1 | 13.0 | 69.5 |
| Bahraich | 6877 | 27.6 | Bahraich | 3.1 | 11.2 | 8.3 | 29.9 | 37.5 |
| Ballia | 2981 | 22.6 | Ballia | 0.5 | 2.1 | 1.4 | 6.0 | 35.1 |
| Banda | 7624 | 18.6 | Banda | 0.4 | 2.1 | 1.2 | 6.4 | 33.5 |
| Barabanki | 4402 | 24.2 | Barabanki | 2.4 | 10.1 | 5.2 | 21.7 | 46.5 |
| Bareilly | 4120 | 28.3 | Bareilly | 4.7 | 16.5 | 9.3 | 32.7 | 50.4 |
| Bijnor | 4561 | 24.5 | Bijnor | 7.2 | 29.2 | 9.9 | 40.4 | 72.3 |
| Budaun | 5168 | 24.5 | Budaun | 2.4 | 9.9 | 5.1 | 20.7 | 48.0 |
| Bulandshahar | 4352 | 28.5 | Bulandshahar | 3.1 | 10.8 | 5.6 | 19.8 | 54.6 |
| Deoria | 2613 | 44.4 | Deoria | 1.1 | 2.5 | 9.0 | 20.2 | 12.3 |
| Etah | 4446 | 22.4 | Etah | 1.3 | 5.8 | 2.5 | 11.3 | 51.5 |
| Etawah | 4326 | 21.2 | Etawah | 0.7 | 3.1 | 1.4 | 6.6 | 46.5 |
| Faizabad | 4511 | 29.8 | Faizabad | 2.3 | 7.6 | 4.0 | 13.4 | 56.9 |
| Farrukhabad | 4274 | 24.4 | Fatehgarh | 1.7 | 7.0 | 3.5 | 14.2 | 49.1 |
| Fatepur | 4152 | 19.0 | Fatepur | 1.1 | 5.7 | 2.4 | 12.6 | 45.2 |
| Firozabad | 2361 | 15.3 | Firozabad | 0.8 | 5.5 | 1.6 | 10.8 | 51.2 |
| Ghaziabad | 2590 | 27.0 | Ghaziabad | 1.9 | 7.2 | 5.7 | 21.2 | 33.9 |
| Ghazipur | 3377 | 24.2 | Ghazipur | 1.3 | 5.5 | 2.4 | 10.1 | 54.5 |
| Gonda | 7352 | 35.7 | Gonda | 3.6 | 10.0 | 9.1 | 25.4 | 39.6 |
| Gorakhpur | 3325 | 30.7 | Gorakhpur | 1.2 | 3.8 | 2.5 | 8.1 | 47.3 |
| Hamirpur | 4098 | 14.7 | Hamirpur | 0.4 | 2.6 | 1.1 | 7.3 | 35.5 |
| Hardoi | 5986 | 27.5 | Hardoi | 1.3 | 4.9 | 3.5 | 12.6 | 38.9 |
| Jalaun | 4565 | 12.2 | Orai | 0.5 | 4.2 | 1.1 | 9.3 | 45.0 |
| Jaunpur | 4038 | 32.1 | Jaunpur | 1.3 | 4.1 | 3.1 | 9.7 | 41.9 |
| Jhansi | 5024 | 14.3 | Jhansi | 0.3 | 1.9 | 1.2 | 8.4 | 22.8 |
| Kanpur Dehat | 5111 | 21.4 | Akbarpur | 1.3 | 5.9 | 1.5 | 6.9 | 85.7 |
| Kanpur Nagar | 1065 | 24.2 | Kanpur Nagar | 2.9 | 11.9 | 4.3 | 17.8 | 66.9 |
| Kheri | 7680 | 24.2 | Kheri | 1.4 | 5.7 | 4.4 | 18.1 | 31.8 |
| Lalitpur | 5039 | 7.5 | Lalitpur | 0.09 | 1.2 | 0.2 | 2.7 | 42.7 |
| Lucknow | 2528 | 27.6 | Lucknow | 3.5 | 12.8 | 5.4 | 19.7 | 65.3 |
| Mahrajganj | 2948 | 16.8 | Mahrajganj | 0.5 | 3.2 | 2.7 | 15.9 | 20.3 |
| Mainpuri | 2760 | 13.2 | Mainpuri | 0.5 | 3.7 | 0.7 | 5.1 | 72.1 |
| Mathura | 3811 | 19.3 | Mathura | 0.3 | 1.7 | 1.6 | 8.1 | 20.6 |
| Mau | 1713 | 14.5 | Mau | 2.0 | 13.9 | 2.6 | 17.9 | 77.6 |
| Merrut | 3911 | 34.5 | Merrut | 9.0 | 26.1 | 9.5 | 27.5 | 94.9 |
| Mirzapur | 4522 | 16.6 | Mirzapur | 0.2 | 1.4 | 1.2 | 7.0 | 20.6 |
| Moradabad | 5967 | 41.2 | Moradabad | 11.6 | 28.2 | 17.6 | 42.7 | 66.1 |
| Moradabad | 5967 | 41.2 | Moradabad | 11.6 | 28.2 | 17.6 | 42.7 | 66.1 |
| Muzaffarnagar | 4008 | 28.4 | Muzaffarnagar | 4.3 | 15.0 | 9.8 | 34.5 | 43.5 |
| Pilibhit | 3499 | 12.8 | Pilibhit | 1.9 | 14.8 | 3.0 | 23.1 | 64.1 |
| Pratapgarh | 3717 | 22.1 | Pratapgarh | 1.0 | 4.4 | 2.9 | 13.2 | 33.6 |
| Rai Bareli | 4609 | 23.2 | Rai Bareli | 0.8 | 3.5 | 2.6 | 11.3 | 30.9 |
| Rampur | 2367 | 15.0 | Rampur | 5.8 | 38.5 | 7.2 | 47.9 | 80.2 |
| Saharanpur | 3689 | 23.1 | Saharanpur | 5.6 | 24.3 | 8.3 | 36.1 | 67.3 |
| Shahjahanpur | 4575 | 19.9 | Shahjahanpur | 2.1 | 10.5 | 3.5 | 17.6 | 59.8 |
| Sidharthnagar | 3495 | 17.1 | Navgarh | 2.4 | 13.9 | 4.9 | 28.8 | 48.3 |
| Sitapur | 5743 | 28.6 | Sitapur | 2.5 | 8.8 | 5.0 | 17.4 | 50.8 |
| Sonbhadra | 6788 | 10.8 | Robertsganj | 0.07 | 0.7 | 0.5 | 4.9 | 13.4 |
| Sultanpur | 4436 | 25.6 | Sultanpur | 1.8 | 7.0 | 3.3 | 12.9 | 53.9 |
| Unnao | 4558 | 22.0 | Unnao | 0.8 | 3.8 | 2.3 | 10.7 | 35.4 |
| Varanasi | 4036 | 48.6 | Varanasi | 3.2 | 6.5 | 6.2 | 12.8 | 50.8 |
| Total | 1320.5 | 120.86 | 9.15 | 234.1 | 17.7 | 51.6 |
Table 2: Area, Population, and Headquarters of Districts in Uttaranchal.
Population Figures are given in lakhs.
| District | Area (sq.km) | Population | Headquarters | Total Urdu Population | %between 3 and 5 | Muslim Population | % between 3 and 6 | % between 5 and 6 |
| 1 | 2 | 3 | 4 | 5 | 6 | |||
| Almora | 5385 | 8.4 | Almora | 0.03 | 0.4 | 0.05 | 0.6 | 55.3 |
| Chamoli | 9126 | 4.5 | Gopeshwar | 0.006 | 0.1 | 0.03 | 0.7 | 19.2 |
| Dehradun | 3088 | 10.3 | Dehradun | 0.5 | 4.4 | 1.0 | 9.6 | 45.8 |
| Pauri Garhwal | 5438 | 6.8 | Garhwal | 0.06 | 0.9 | 0.2 | 2.3 | 39.1 |
| Hardwar | 2360 | 11.2 | Hardwar | 1.8 | 16.4 | 3.4 | 30.1 | 54.7 |
| Nainital | 6794 | 15.4 | Nainital | 1.6 | 10.7 | 2.3 | 15.2 | 70.3 |
| Pitoragarh | 8856 | 5.7 | Pitoragarh | 0.01 | 0.2 | 0.03 | 0.5 | 46.5 |
| Tehri Garhwal | 4421 | 5.8 | New Tehri | 0.006 | 0.1 | 0.05 | 0.8 | 12.2 |
| Uttarkashi | 8016 | 2.4 | Uttarkashi | 0.008 | 0.3 | 0.02 | 0.9 | 37.6 |
| Total | 70.5 | 4.02 | 5.7 | 7.08 | 10.0 | 56.8 |
4. URDU IN UTTAR PRADESH AND UTTARANCHAL
Urdu is an important language of Uttar Pradesh and Utranchal. While Hindi is the official language, Urdu has been declared as an additional official language of Uttar Pradesh. The State Government has notified the following areas, where the linguistic minority population (speakers of Urdu) constitute 15 per cent or more of the local population.
- Bareilly, Bijnor, Lucknow, Meerut, Moradabad, Muzaffarnagar, Rampur and Saharanpur districts.
- Najibabad, Bijnor, Nagina and Dhampur tehsils of Bijnor district.
- Hasanpur, Sambhal, Amroha, Thakurdwara, Moradabad and Bilari tehsils of District Moradabad.
- Suar, Bilaspur, Rampur and Sahibabad tehsils of District Rampur.
- Baheri and Bareilly tehsils of District Bareilly.
- Pilibhit and Puranpur tehsils of District Pilibhit.
- Nakur, Roorkee and Saharnpur tehsils of District Saharanpur.
- Kairana and Muzaffarnagar tehsils of District Muzaffarnagar.
- Sardhana, Mawana and Hapur tehsils of District Meerut.
- Nanpura tehsil of District Baharaich.
- Balampur and Utraula tehsils of District Gonda.
- Fatehpur tehsil of District Barabanki.
- Domariganj and Nagaur tehsils of District Basti.
A total of 124.9 lakh persons speak Urdu in the state.
5. G0VERNANCE THROUGH URDU IN UTTAR PRADESH
The State Government has also declared Urdu as the second official language for the following purposes:
- Entertaining petitions and applications in Urdu and replies thereof in Urdu.
- Receiving documents written in Urdu by the Registration Office.
- Publication of important Government Rules, Regulations, and Notifications in Urdu.
- Issuing Government Orders and Circulars of public importance in Urdu.
- Publication of important Government advertisements in Urdu.
- Publication of Urdu notification in the Gazette.
- Exhibition of important signposts in Urdu.
An Urdu Cell is functioning in Lucknow, the capital of Uttar Pradesh, for the translation of important rules, regulations, notices, etc. in Urdu. The official Gazette is also published in Urdu.
6. DISTRICT-WISE BREAK-UP OF URDU POPULATION UTTAR PRADESH AND UTTARANCHAL
A detailed district-wise break-up of the total Urdu population in Uttar Pradesh is shown in Table 3 given below.
Table 3: District -wise Break-up of Urdu Population in Uttar Pradesh and Uttaranchal
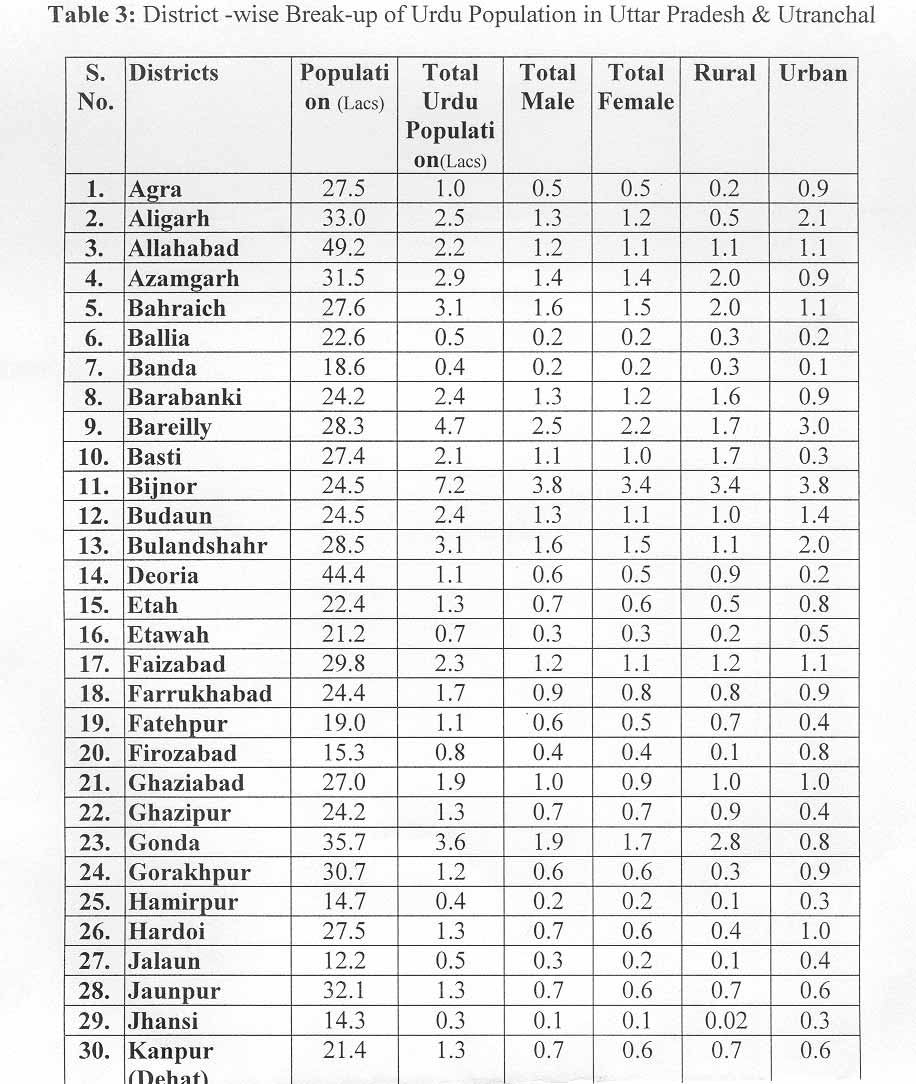
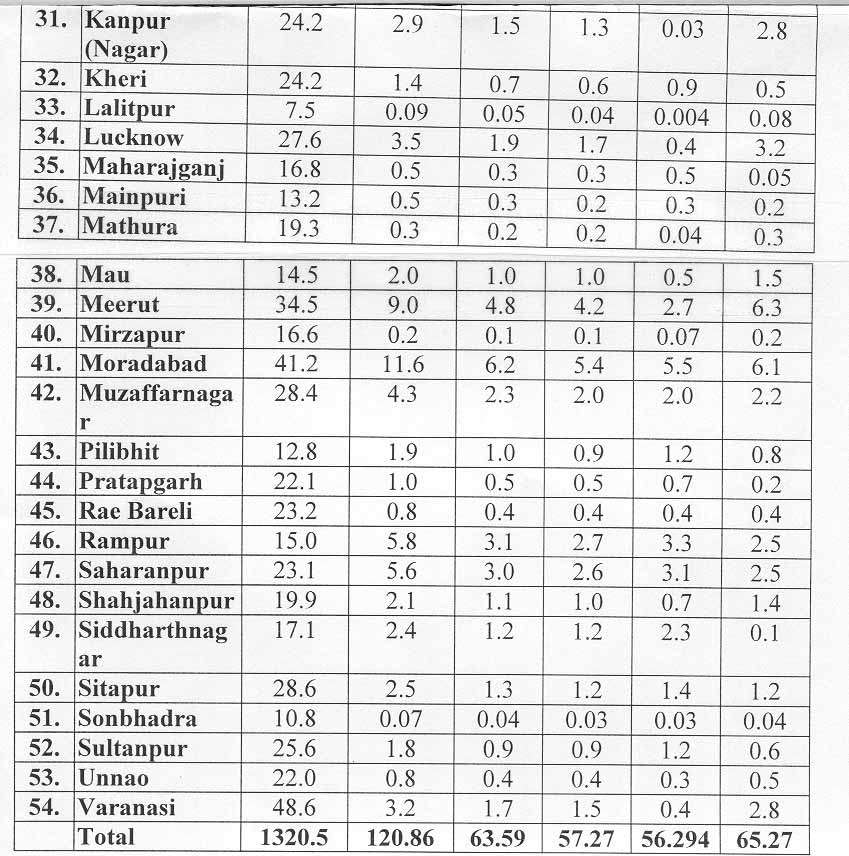
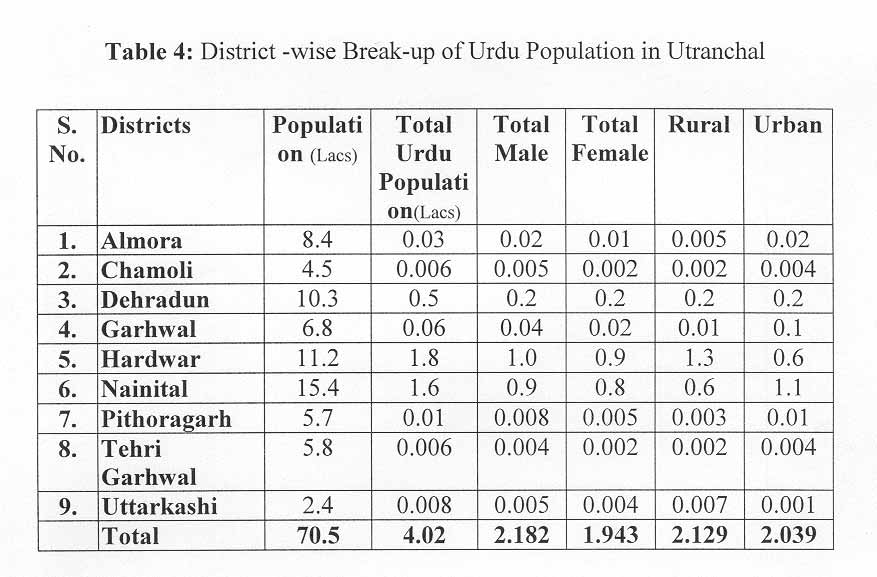
Table 4: District-wise Break-up of Urdu Population in Uttaranchal
7. URDU POPULATION IS MORE URBAN-BASED
In the light of the figures given above, we may draw the conclusion that the Urdu-speaking population is rather equally divided between the rural and urban segments of Uttar Pradesh, although, to some extent, we may argue that the Urdu population is slated more an urban-based language in Uttar Pradesh and Uttaranchal. The graph presented below shows the rural/urban division of Urdu population in Uttar Pradesh and Uttaranchal.
Chart 1: Rural and Urban Division of Urdu Population in Uttar Pradesh
Chart 2: Rural and Urban Division of Urdu Population in Uttaranchal
As shown in the piecharts, the percentage of rural Urdu speakers is only 46%, while the percentage of urban speakers is 54%.
The numerical strength of Urdu speakers shows an uneven distribution over different districts in Uttar Pradesh and Uttaranchal. The difference in numerical strength of Urdu speakers varies from a few hundred to thousands in the various districts of Uttar Pradesh and Uttaranchal.
8. TOP TEN DISTRICTS OF URDU SPEAKING POPULATION IN UTTAR PRADESH AND UTTARANCHAL
The top ten districts that have some concentration of Urdu speakers are identified and presented below in Table 5.
Table 5: Top Ten Districts
Population Figures are given in lakhs.
S. No. District Population Total Urdu Population %age 1. Bareilly 28.3 4.7 16.47 2. Bijnor 24.5 7.2 29.16 3. Hardwar 11.2 1.8 16.44 4. Meerut 34.5 9.0 26.10 5. Moradabad 41.2 11.6 28.24 6. Muzaffarnagar 28.4 4.3 15.02 7. Pilibhit 12.8 1.9 14.83 8. Rampur 15.0 5.8 38.46 9. Saharanpur 23.1 5.6 24.31 10. Siddharthnagar 17.1 2.4 13.91 On the basis of the figures presented in the table above, the following observations can be made.
- All ten districts have a concentration of Urdu speakers of over 10% of the total population.
- District Muzaffarnagar has more than four lacs of Urdu speakers, which is 15.0% of the total population of the district.
- Pilibhit and Siddharthnagar occupy Ninth and Tenth positions with 14.8% and 13.9%.
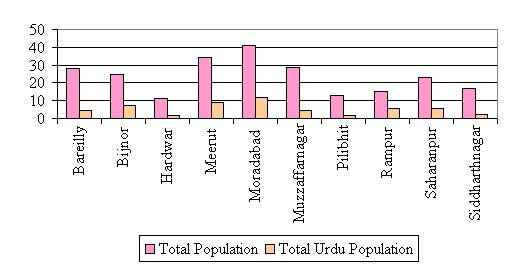
The given below presents the gap between Urdu population and Total population in the top ten districts of Urdu population in Uttar Pradesh and Uttaranchal. As shown in the graph, the difference between the Urdu population and the total population is maximum in Moradabad and minimum in Rampur.
Chart 3: Total Population and Total Urdu Population in Urdu-speaking Districts
9. URDU AS AN ICON OF MUSLIM IDENTIFICATION
Muslims have contributed considerably to development of Urdu language. As a result Urdu is often regarded as an icon of Muslim identification.
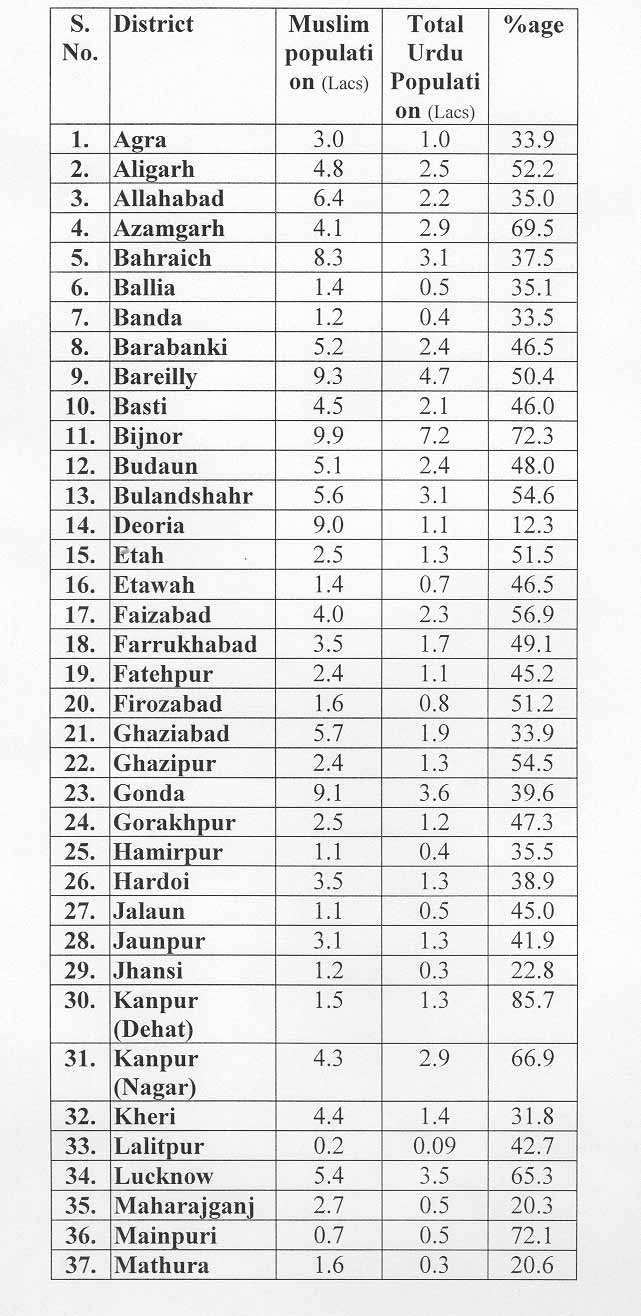
To assess the validity of the title "Urdu as an icon of Muslim identification", the section provides a distribution of Muslim and Urdu population in Uttar Pradesh and Uttaranchal. The table given below provides a district-wise distribution of Muslim and Urdu-speaking populations.
Table 6: District-wise Break-up of Muslim/Urdu Population Ratio in Uttar Pradesh
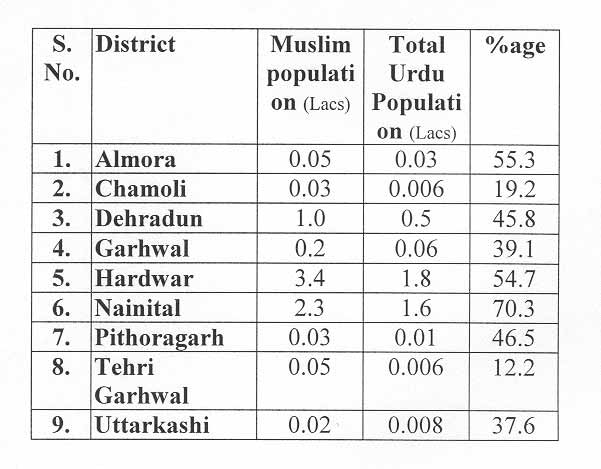
Table 7: District-wise Break-up of Muslim/Urdu Population Ratio in Uttaranchal
The figures presented in the tables above indicate that not all Muslims claim Urdu as their mother tongue. The fact that around fifty percent of Muslims do not claim Urdu as their mother tongue demolishes the myth that Urdu is an icon of Muslim identification.
10. DECENNIAL GROWTH OF MUSLIMS AND URDU SPEAKERS
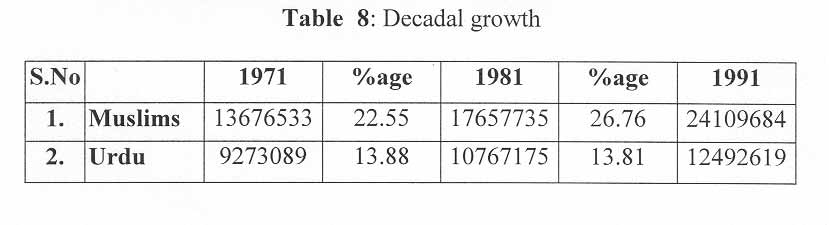
Ethnic or group identification through a specific Linguistic Identification is very much a matter of social awareness on the part of an individual. Change in Linguistic Identification does not signify change in linguistic behaviour. Oscillation in mother-tongue declaration reveals a shift in social identification under changed circumstances. The table given below presents the decadal growth of Muslims and Urdu speakers reported in 1971, 1981 and 1991 census reports.
Table 8: Decennial Growth
Table 8 indicates that there is no considerable fall in the decennial growth of Urdu speakers in the state during 1971 to 1981, and 1981 to 1991. In other words, Urdu Population maintains its level of growth.
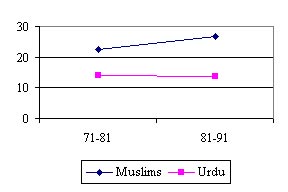
The decennial growth of Muslims in Uttar Pradesh and Uttaranchal shows a slight increase ranging between 22 to 26 per cent during 1971 to 1981 and 1981 to 1991. The chart given below show the steady increases in the figures of Muslim population.
Chart 4: Decennial growth in Muslim Population and Urdu Speakers
11. BILINGUALISM AMONG URDU SPEAKERS
The Urdu population is mostly scattered throughout the country. So, a large proportion of Urdu speakers in many regions tend to have, along with Urdu, bilingual control over the respective dominant language of the region in which they live. The table below presents figures of bilingualism among Urdu speakers.
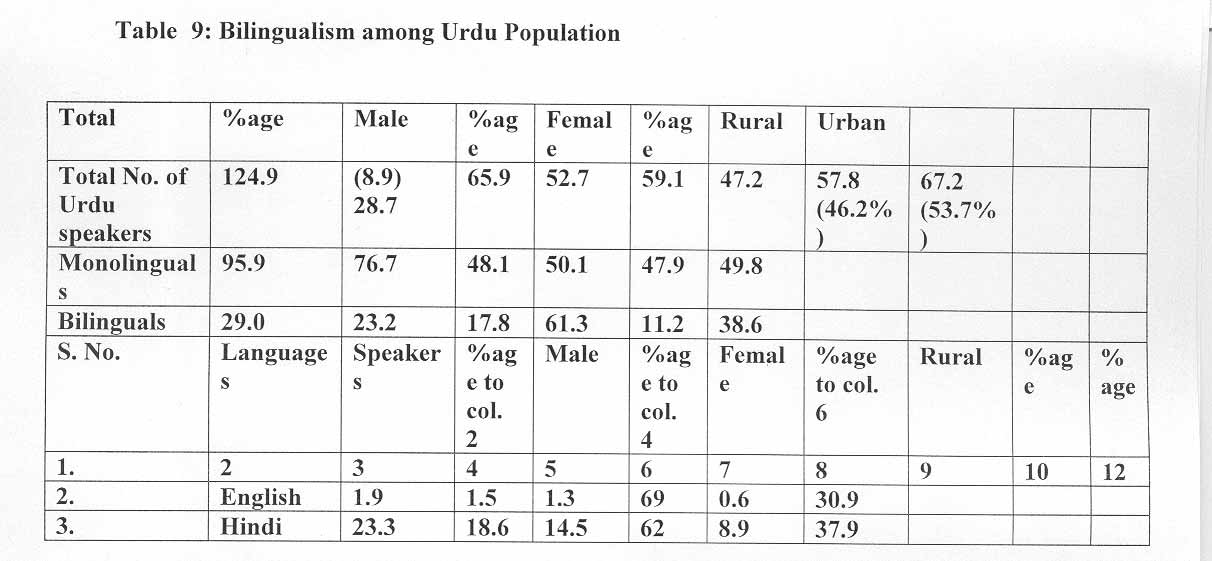
Table 9: Bilingualism among Urdu Population in Uttar Pradesh and Uttaranchal
The figures presented in the table indicate that bilingualism among Urdu speakers is much lower than the State average. 23.2% of the total Urdu population is bilingual; Hindi is the most preferred language among the Urdu speakers of Uttar Pradesh and Uttaranchal. 18% of the total Urdu population has bilingualism in Hindi.
12. LITERACY IN URDU POPULATED AREAS (State Literacy Rate 33.17%)
Despite the progress of literacy programmes in India, there are more illiterate adults in India today than there were in 1951. However, we may not ignore the fact that the literacy rates in the country have shown a steady increase of about eight percent every decade since 1951, from a national average of 19.74% in 1951.
The literacy level is linked with the urban/rural factor in a significant way. The largest number of illiterates lives in the rural areas. According to the 1991 census, 74.30 per cent of the total Indian population lives in the rural areas and 25.7 percent in urban areas. On the other hand the literacy rate in urban areas is 61.72 percent, while in the rural areas it is 36.31 percent.
The male/female parameter is also very significant in literacy. Males show a higher literacy rate than females.
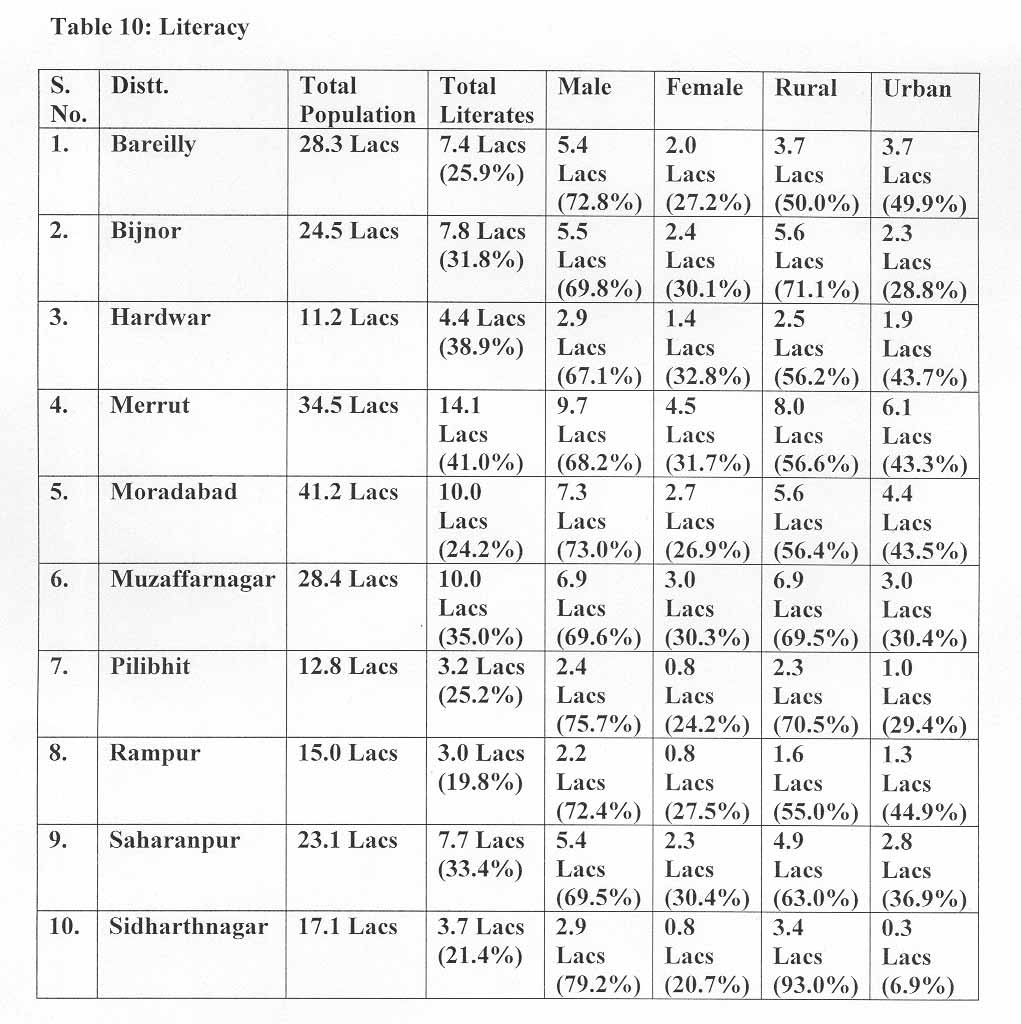
The table given below presents the figures of literacy among Urdu-speaking populations in the ten top Urdu populated districts of Uttar Pradesh and Uttaranchal.
Table 10: Literacy Rate
Chart 5: Total Population and Total Literates in Urdu Populated Areas
The graph presented above indicates that the language issue is interlinked with the urban and rural factors in a significant way. The rural districts of Uttar Pradesh and Uttaranchal show a high degree of illiteracy in comparison to the urban centres.
13. LEVEL I OF EDUCATION AMONG URDU POPULATION
In late nineties India adopted a series of policies and programmes to improve its literacy rate. These included the approval and adoption of the program called EDUCATION FOR ALL. Most of these policies aimed at improving Primary education especially in rural areas.
In response to widespread concerns over the deteriorating quality of the education system on the one hand and the importance of education for national and for global participation, the Ministry of Human Resource Development, Government of India introduced the program EDUCATION FOR ALL.
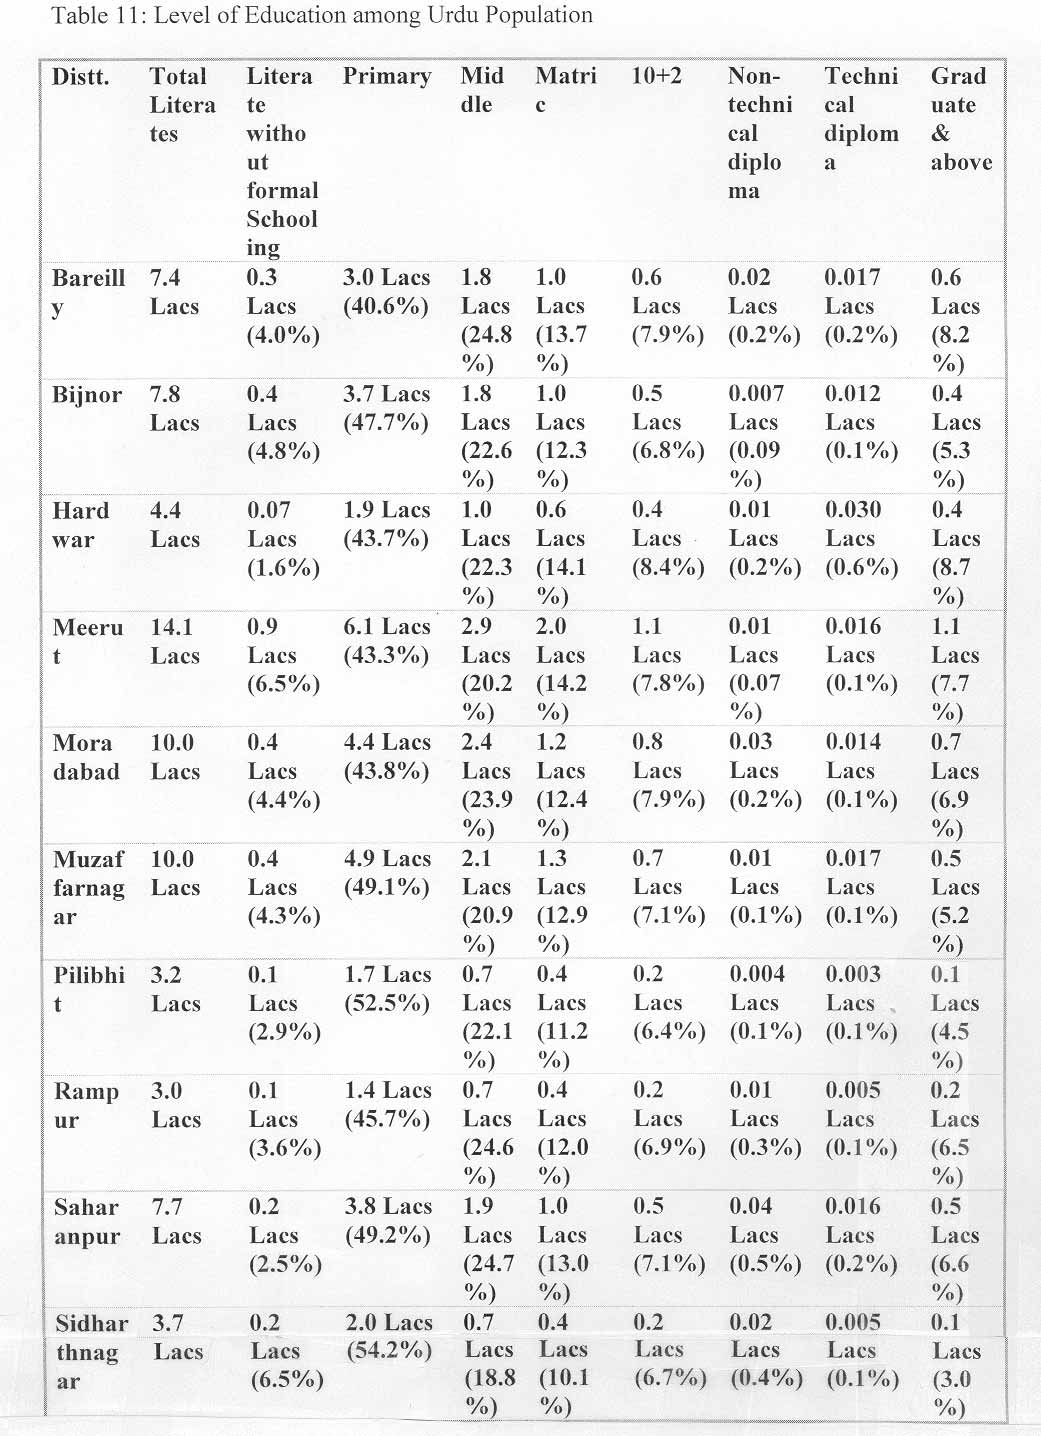
The table given below presents the level of education in Urdu populated areas of the state.
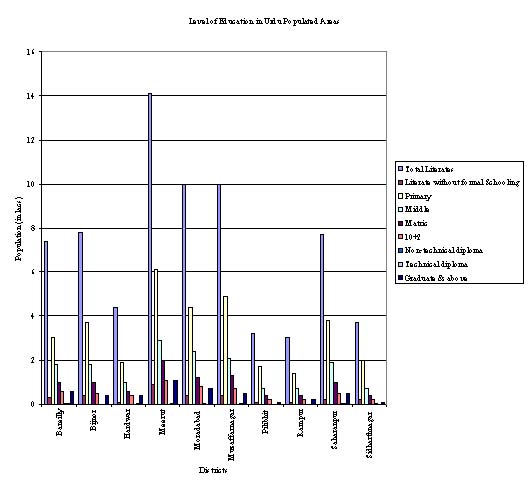
Table 11: Level of Education among Urdu Population
Chart 6: Level of Education in Urdu Populated Areas
As per the Linguistic Minorities Commission report, there are 1573 Primary schools with 10068 teachers imparting instruction through Urdu to 268056 pupils in the State.
Fatihi (1999) gives the following statistical information about Urdu education in U.P.
Source: Muslim India 205, Jan. 2000.
S. No. Types of School Number of School Number of Students Teachers 1. Primary Schools where Urdu is taught as a subject 5581 175000 6082 2. Primary Schools where Urdu is the medium of instruction 422 268000 --- 3. Recognized Maktabs 1155 --- --- 4. Aided Maktabs 814 --- --- 5. Government Junior High Schools where Urdu is taught as a subject 4453 --- --- 6. Government Junior High Schools where Urdu is the medium of instruction 0 --- --- 7. Private Junior High Schools where Urdu is taught as a subject 364 59972 4817 8. Private Junior High Schools where Urdu is the medium of instruction 18 224 73 As shown in the table, the number of Urdu medium schools in U.P. is deplorably low.
14. URDU AS THE MEDIUM OF INSTURUCTION
As already mentioned, government orders ask for imparting instruction through the mother tongue, if a minimum of 10 pupils in a class or 40 in a school so desire. English, Urdu, Punjabi, Sindhi, and Benglai are the minority languages, which are actually recognized as medium of instruction.
Table 12 Total Number of Languages used as Medium of Instruction in Uttar Pradesh and Uttaranchal.
Primary Upper Primary Secondary Higher NCERT Third Survey 4 4 2 2 NCERT Fifth Survey 3 3 2 2 The three-language formula followed in the State provides for the study of languages as under:
- Hindi as the first language.
- English as the second language.
- Any language included in the VIII Schedule of the Constitution as the third language.
As shown in the table, education through the Urdu medium is available only at primary and upper primary levels. At secondary and higher secondary levels, students are asked to opt for English or Hindi as medium of instruction.
15. TO CONCLUDE
Although Urdu is closely associated with Muslims, it is clear from the data presented in this article that a large number of Urdu speakers are non-Muslims in Uttar Pradesh. Urdu is used as a language of common men and women in this state. The future of Urdu depends on the continuance of this situation to some extent. It is important that Urdu is allowed to be taught as a medium of instruction also at the secondary and higher secondary levels of education. If simplicity in communication is encouraged through mass media, Urdu is bound to flourish further.
HOME PAGE | BACK ISSUES | Urdu In Uttar Pradesh and Uttaranchal | The Verb BE in Assamese | Hindustani as an Anxiety Between Hindi - Urdu Commitment : Linguistic Engineering of Language Loyalty | Language News This Month: Bodo Land | Language of Globalization: A Case Study of Tamil Advertisements | A Case for Roman Lipi for Indian Languages | Some New Books in Indian Linguistics | CONTACT EDITOR
A. R. Fatihi, Ph.D.
Visiting Senior Faculty
Cornell University
E-mail: arf26@cornell.edu