BOOKS FOR YOU TO READ AND DOWNLOAD
- Vocabulary Education by
B. Mallikarjun, Ph.D. - A CONTRASTIVE ANALYSIS OF HINDI AND MALAYALAM by V. Geethakumary, Ph.D.
- LANGUAGE OF ADVERTISEMENTS IN TAMIL by Sandhya Nayak, Ph.D.
- An Introduction to TESOL: Methods of Teaching English to Speakers of Other Languages by M. S. Thirumalai, Ph.D.
- Transformation of Natural Language into Indexing Language: Kannada - A Case Study by B. A. Sharada, Ph.D.
- How to Learn Another Language? by M.S.Thirumalai, Ph.D.
- Verbal Communication with CP Children by Shyamala Chengappa, Ph.D. and M.S.Thirumalai, Ph.D.
- Bringing Order to Linguistic Diversity - Language Planning in the British Raj by
Ranjit Singh Rangila,
M. S. Thirumalai,
and B. Mallikarjun
REFERENCE MATERIAL
- Languages of India, Census of India 1991
- The Constitution of India: Provisions Relating to Languages
- The Official Languages Act, 1963 (As Amended 1967)
- Mother Tongues of India, According to 1961 Census of India
BACK ISSUES
- E-mail your articles and book-length reports to thirumalai@bethfel.org or send your floppy disk (preferably in Microsoft Word) by regular mail to:
M. S. Thirumalai
6820 Auto Club Road #320
Bloomington, MN 55438 USA. - Contributors from South Asia may send their articles to
B. Mallikarjun,
Central Institute of Indian Languages,
Manasagangotri,
Mysore 570006, India or e-mail to mallik_ciil@hotmail.com. - Your articles and booklength reports should be written following the MLA, LSA, or IJDL Stylesheet.
- The Editorial Board has the right to accept, reject, or suggest modifications to the articles submitted for publication, and to make suitable stylistic adjustments. High quality, academic integrity, ethics and morals are expected from the authors and discussants.
Copyright © 2001
M. S. Thirumalai
URDU IN KARNATAKA
A. R. Fatihi, Ph.D.
1. KARNATAKA: A MULTI-LINGUAL STATE LIKE OTHER INDIAN STATES
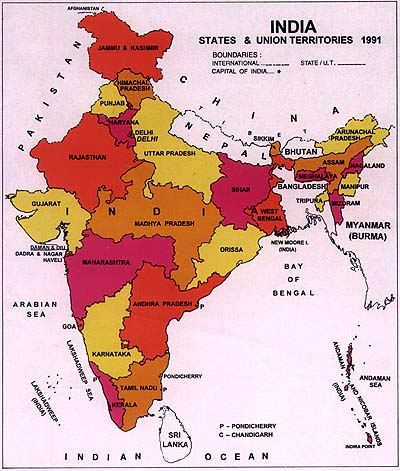
Karnataka lies to the south of Goa and Maharashtra, to the west of Andhra Pradesh, to the west of Tamil Nadu, and to the north of Kerala. Karnataka has a written history of more than 2,000 years. After independence, the new united Mysore State was created in 1956 and was renamed Karnataka in 1973.
The State of Karnataka has a population of 4,49,77,201 persons, according to the 1991 Census of India. The regional language of the State is Kannada whose speakers constitute 64.75 per cent of the population.
The major linguistic minority groups in the State comprise the speakers of Urdu (9.72%), Telugu (8.34%), Marathi (3.95%), Tamil (3.82%), Malayalam (1.69%), Tulu (3.38%), Konkani (1.78%), and Hindi (1.87%).
The speakers of minority languages who constitute less than 1 per cent are the speakers of Gujarati (0.10%) and Coorgi/Kodagu (0.25%).
The minority language speakers who constitute less than 0.09 per cent are the speakers of Bengali (0.03%), Punjabi (0.03%), Sindhi (0.03%), Oriya (0.01%), Arabic/Arbi, (0.01%) Gorkhali/Nepali (0.01%) and Tibetan (0.05%).
2. URDU SPEAKERS AND MUSLIM POPULATION IN KARNATAKA DISTRICTS
The names of the Districts along with the actual percentage of population, districts headquarters, and the total Urdu population in each district are given below in Table 1
Table 1: Area, Population, and Headquarters of Districts
| Districts | Area (sq. km) | Population (Lacs) | Headquarters | Total Urdu Population (Lacs) | %age(Between 3 & 5) | Muslim Population (Lacs) | %age(Between 3 & 7) | %age(Between 5 & 7) |
| 1 | 2 | 3 | 4 | 5 | 6 | 7 | 8 | 9 |
| Bangalore | 2190 | 48.4 | Bangalore | 6.1 | 12.7 | 6.3 | 13.1 | 96.4 |
| Bangalore Rural | 5815 | 16.7 | Bangalore Rural | 1.4 | 8.3 | 1.4 | 8.6 | 96.8 |
| Belgaum | 13415 | 35.8 | Belgaum | 3.1 | 8.7 | 3.6 | 10.1 | 86.2 |
| Bellary | 9885 | 18.9 | Bellary | 2.0 | 10.7 | 2.3 | 12.1 | 88.7 |
| Bidar | 5448 | 12.6 | Bidar | 2.4 | 18.7 | 2.4 | 19.3 | 97.1 |
| Bijapur | 17069 | 29.3 | Bijapur | 3.4 | 11.8 | 3.9 | 13.4 | 87.8 |
| Chikmagalur | 7201 | 10.2 | Chikmagalur | 0.7 | 6.7 | 0.8 | 8.0 | 83.2 |
| Chitradurga | 10852 | 21.8 | Chitradurga | 2.0 | 9.3 | 2.1 | 9.8 | 95.5 |
| Dakshina Kannada | 8441 | 26.9 | Mangalore | 0.7 | 2.6 | 4.0 | 14.8 | 17.7 |
| Dharwad | 13738 | 35.0 | Dharwad | 4.8 | 13.8 | 5.8 | 16.4 | 84.0 |
| Gulbarga | 16224 | 25.8 | Gulbarga | 4.4 | 16.9 | 4.4 | 17.2 | 98.3 |
| Hassan | 6814 | 15.7 | Hassan | 0.8 | 5.2 | 0.8 | 5.4 | 95.7 |
| Kodagu | 4102 | 4.9 | Kodagu | 0.1 | 2.8 | 0.7 | 13.6 | 20.8 |
| Kolar | 8223 | 22.2 | Kolar | 2.5 | 11.3 | 2.5 | 11.4 | 98.8 |
| Mandya | 4961 | 16.4 | Mandya | 0.6 | 3.9 | 0.7 | 4.0 | 98.1 |
| Mysore | 11954 | 31.7 | Mysore | 2.2 | 6.9 | 2.3 | 7.3 | 94.7 |
| Raichur | 14017 | 23.1 | Raichur | 2.4 | 10.6 | 2.9 | 12.7 | 83.3 |
| Shimoga | 10553 | 19.1 | Shimoga | 2.0 | 10.5 | 2.1 | 11.0 | 95.0 |
| Tumkur | 10598 | 23.1 | Tumkur | 1.7 | 7.5 | 1.8 | 7.7 | 97.8 |
| Uttara Kannada | 10291 | 12.2 | Uttara Kannada | 1.3 | 10.3 | 1.3 | 11.0 | 93.7 |
| Total | 449.8 | 44.8 | 10.0 | 52.3 | 11.6 | 85.6 |
3. URDU IN KARNATAKA
Kannada is the official language of the State and there is no second official language. The State Government has issued orders for making necessary arrangements to publish important Government notices and rules in minority languages, in addition to Kannada and English, in the areas where the population of linguistic minorities is 15 per cent or more of the local population.
The State Government has directed all the Secretaries to send important Government orders and rules to the Secretary, Information, Tourism and Youth Services Department who, in turn, gets them translated into minority languages through the Directorate of Translation and give a wide publicity to the orders and other notices in the respective linguistic minority areas.
The State Government has notified the areas where the linguistic minority population constitutes 15 per cent or more of the local population, on the basis of 1981 census. The names of districts and the talukas along with the actual percentage of Urdu speaking population are given below:
Urdu- Bellary (16.25%) and Hospet talukas (15.48%) in Bellary district.
- Bidar district (18.30%) and in talukas of Basavakalayana (16.61%), Bidar (28.39%) and Humnabad (23.17%) in Bidar district.
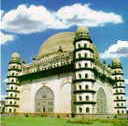
- Bijapur taluka (18.60) in Bijapur district.
- Hangal (18.94%), Hubli-Dharwad (23.11%), Savanur (21.78%) and Shiggaon talukas (20.36%) in Dharwad district.
- Gulbarga district (16.91%) and in the talukas of Chincholi (16.34%), Chitapur (20.07%) and Gulbarga (27.22%) in Gulbarga district.
- Kolar taluka (16.74%) in Kolar district.
- Raichur taluka (15.20%) in Raichur district.
- Shimoga taluka (15.49%) in Shimoga district.
- Bhatkala taluka (25.65) in Uttara Kannada district.
4. URDU SPEAKING RURAL/URBAN POPULATION IN KARNATAKA DISTRICTS
A detailed district wise break-up of the Urdu Population in Karnataka is shown in Table 2.
Table 2: District -wise Break-up of Urdu Population in Karnataka
| S. No. | Districts | Total Population (Lacs) | Total Urdu Population (Lacs) | Total Male (Lacs) | Total Female (Lacs) | Rural (Lacs) | Urban (Lacs) |
| 1. | Bangalore | 48.4 | 6.1 | 3.2 | 2.9 | 0.3 | 5.8 |
| 2. | Bangalore Rural | 16.7 | 1.4 | 0.7 | 0.7 | 0.6 | 0.8 |
| 3. | Belgaum | 35.8 | 3.1 | 1.6 | 1.5 | 1.5 | 1.6 |
| 4. | Bellary | 18.9 | 2.0 | 1.0 | 1.0 | 0.7 | 1.3 |
| 5. | Bidar | 12.6 | 2.4 | 1.2 | 1.1 | 1.4 | 1.0 |
| 6. | Bijapur | 29.3 | 3.4 | 1.7 | 1.7 | 1.7 | 1.7 |
| 7. | Chikmagalur | 10.2 | 0.7 | 0.3 | 0.3 | 0.4 | 0.3 |
| 8. | Chitradurga | 21.8 | 2.0 | 1.0 | 1.0 | 1.0 | 1.4 |
| 9. | Dakshina Kannada | 26.9 | 0.7 | 0.3 | 0.3 | 0.4 | 0.3 |
| 10. | Dharwad | 35.0 | 4.8 | 2.5 | 2.4 | 1.9 | 2.9 |
| 11. | Gulbarga | 25.8 | 4.4 | 2.2 | 2.1 | 2.3 | 2.1 |
| 12. | Hassan | 15.7 | 0.8 | 0.4 | 0.4 | 0.3 | 0.5 |
| 13. | Kodagu | 4.9 | 0.1 | 0.1 | 0.07 | 0.05 | 0.1 |
| 14. | Kolar | 22.2 | 2.5 | 1.3 | 1.2 | 1.2 | 1.3 |
| 15. | Mandya | 16.4 | 0.6 | 0.3 | 0.3 | 0.2 | 0.4 |
| 16. | Mysore | 31.7 | 2.2 | 1.1 | 1.1 | 0.6 | 1.6 |
| 17. | Raichur | 23.1 | 2.4 | 1.2 | 1.2 | 1.1 | 1.3 |
| 18. | Shimoga | 19.1 | 2.0 | 1.0 | 1.0 | 1.1 | 0.9 |
| 19. | Tumkur | 23.1 | 1.7 | 0.9 | 0.8 | 0.8 | 0.9 |
| 19. | Tumkur | 23.1 | 1.7 | 0.9 | 0.8 | 0.8 | 0.9 |
| 20. | Uttara Kannada | 12.2 | 1.3 | 0.6 | 0.6 | 0.6 | 0.6 |
| Total | 449.8 | 44.8 | 22.9 | 21.9 | 17.8 | 27.0 |
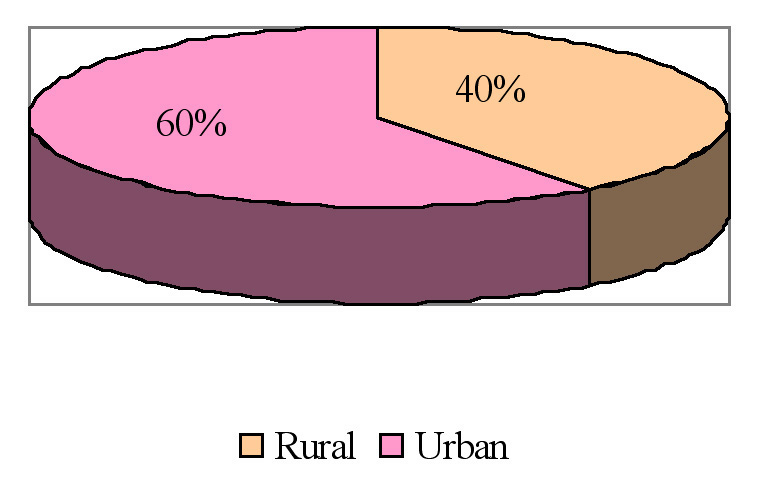
In the light of the figures given above we may draw the conclusion that Urdu is basically used in the urban settings in Karnataka.
The Urban/Rural division of Urdu population is presented diagrammatically below. The graph presented below exhibits the rural/urban division of Urdu population in Karnataka.
Chart 1: Rural and Urban Division of Urdu Population
Moreover, the concentration of speakers of Urdu shows an uneven distribution over different districts in Karnataka. The difference in the numerical strength of Urdu speakers varies from a few hundreds to thousands.
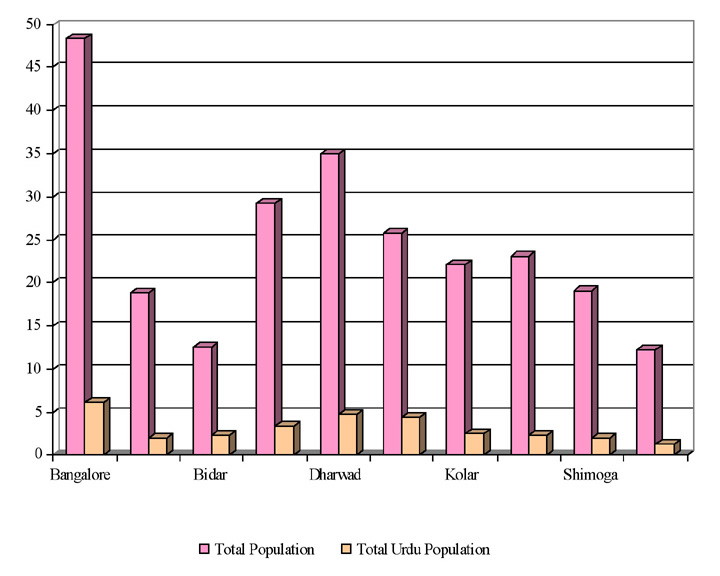
5. TOP TEN DISTRICTS OF URDU POPULATION IN KARNATAKA
There is a wide range of difference in the numerical strength and concentration of Urdu speakers in different regions. I present below the top ten districts in Table 3.
Table 3: Top Ten Districts
| S. No. | Districts | Total Population (Lacs) | Total Urdu Population (Lacs) | %age |
| 1. | Bangalore | 48.4 | 6.1 | 12.65 |
| 2. | Bellary | 18.9 | 2.0 | 10.71 |
| 3. | Bidar | 12.6 | 2.4 | 18.72 |
| 4. | Bijapur | 29.3 | 3.4 | 11.76 |
| 5. | Dharwad | 35.0 | 4.8 | 13.81 |
| 6. | Gulbarga | 25.8 | 4.4 | 16.92 |
| 7. | Kolar | 22.2 | 2.5 | 11.27 |
| 8. | Raichur | 23.1 | 2.4 | 10.57 |
| 9. | Shimoga | 19.1 | 2.0 | 10.47 |
| 10. | Uttara Kannada | 12.2 | 1.3 | 10.29 |
On the basis of the figures presented in the table above, the following observations can be made.
- All the top ten districts have a concentration of Urdu speakers of over 10% of the total population.
- District Raichur has above two lacs of Urdu speakers, which is 10.57% of the total population of the district.
- Shimoga and Uttar Kannada districts occupy the ninth and tenth positions with 10.47% and 10.29% respectively.
The graph given below presents the gap between the Urdu population and the total population in the above top ten districts. As shown in the graph the difference between the Urdu population and the total population is maximum in Bangalore and minimum in Gulbarga.
6. IS URDU AN ICON OF MUSLIM IDENTIFICATION?
To assess the validity of the title "Urdu as an Icon of Muslim Identification", this section provides a distribution of Muslim and Urdu population in Karnataka. The table given below provides a district-wise distribution of Muslim and Urdu population.
Table 4: District wise Break-up of Muslim/Urdu Population Ratio
| S. No. | Districts | Total Muslim Population (Lacs) | Total Urdu Population (Lacs) | %age |
| 1. | Bangalore | 6.3 | 6.1 | 96.42 |
| 2. | Bangalore Rural | 1.4 | 1.4 | 96.75 |
| 3. | Belgaum | 3.6 | 3.1 | 86.25 |
| 4. | Bellary | 2.3 | 2.0 | 88.71 |
| 5. | Bidar | 2.4 | 2.4 | 97.14 |
| 6. | Bijapur | 3.9 | 3.4 | 87.84 |
| 7. | Chikmagalur | 0.8 | 0.7 | 83.20 |
| 8. | Chitradurga | 2.1 | 2.0 | 95.47 |
| 9. | Dakshina Kannada | 4.0 | 0.7 | 17.67 |
| 10. | Dharwad | 5.8 | 4.8 | 84.00 |
| 11. | Gulbarga | 4.4 | 4.4 | 98.29 |
| 12. | Hassan | 0.8 | 0.8 | 95.67 |
| 13. | Kodagu | 0.7 | 0.1 | 20.83 |
| 14. | Kolar | 2.5 | 2.5 | 98.84 |
| 15. | Mandya | 0.7 | 0.6 | 98.08 |
| 16. | Mysore | 2.3 | 2.2 | 94.74 |
| 17. | Raichur | 2.9 | 2.4 | 83.32 |
| 18. | Shimoga | 2.1 | 2.0 | 94.95 |
| 19. | Tumkur | 1.8 | 1.7 | 97.85 |
| 20. | Uttara Kannada | 1.3 | 1.3 | 93.70 |
| Total | 52.3 | 44.8 | 85.6 |
The figures presented in the table indicate that not all Muslims claim Urdu as their mother tongue. The fact that non-Muslims also claim Urdu as their mother tongue demolishes the myth that Urdu is an Icon of Muslim Identification.
7. DECADAL GROWTH OF MUSLIMS AND URDU SPEAKERS
Identity through a particular Linguistic Identification is very much a matter of social awareness on the part of an individual. Change in Linguistic Identification does not signify change in linguistic behaviour. Oscillation in mother-tongue declaration reveals a shift in social identification under changed circumstances. The table given below presents the decadal growth of Muslims and Urdu speakers reported in 1971, 1981 and 1991 census reports.
Table 5: Decadal growth
| S.No. | 1971 | %age | 1981 | %age | 1991 | |
| 1. | Muslims | 3113298 | 25.23 | 4163691 | 20.45 | 5,234,023 |
| 2. | Urdu | 2636688 | 24.94 | 3512831 | 21.42 | 4470645 |
The Table indicates a considerable slide ranging between 21 to 24 per cent among Urdu speakers in the state during 1971 to 1981, and 1981 to 1991. In other words, Urdu Population slides from 24.94% to 21.42% in the decade 1981-91.
The decadal growth of Muslims in Karnataka show a slightly slow decrease ranging between 25 to 20 per cent during 1971 to 1981 and 1981 to 1991. There is a steep decrease in case of Urdu.
8. BILINGUALISM AMONG URDU SPEAKERS
The Urdu population is mostly scattered throughout the country, hence a large proportion of Urdu speakers in many regions tend to have bilingual control over the respective language of the region along with Urdu.
The table below presents the figures of bilingualism among Urdu speakers in Karnataka.
Table 6: Bilingualism among Urdu Population
| Total | %age | Male | %age | Female | %age | Rural | Urban | |||
| Total No. of Urdu speakers | 44.8 | (9.9) 10.3 | 22.9 | 51.1 | 21.9 | 48.8 | 17.8 (39.8%) | 27.0 (60.2%) | ||
| Monolinguals | 19.0 | 42.4 | 8.9 | 47 | 10.1 | 52.9 | ||||
| Bilinguals | 25.8 | 57.5 | 14.0 | 54.2 | 11.8 | 45.7 | ||||
| S. No. | Languages | Speakers | %age | Male | %age | Female | %age | |||
| 1. | Arabic | 0.9 | 1.9 | 0.5 | 51.1 | 0.4 | 48.8 | |||
| 2. | English | 2.0 | 4.5 | 1.1 | 56.7 | 0.9 | 43.2 | |||
| 3. | Hindi | 1.6 | 3.5 | 0.9 | 58.3 | 0.7 | 41.6 | |||
| 4. | Kannada | 19.5 | 43.5 | 10.5 | 54 | 9.0 | 45.9 | |||
| 5. | Marathi | 0.4 | 0.9 | 0.2 | 51.1 | 0.2 | 48.8 | |||
| 6. | Tamil | 0.4 | 0.9 | 0.2 | 51.1 | 0.2 | 48.8 | |||
| 7. | Telugu | 0.9 | 1.9 | 0.5 | 51.1 | 0.4 | 48.8 |
The figures presented in the table indicate that bilingualism among Urdu speakers is much higher than the State average. 57.5% of the total Urdu population in Karnataka are bilingual; Kannada is the most preferred language among the Urdu speakers of Karnataka. 43.5% of the total Urdu population has bilingualism in Kannada. The figures presented above display a sense of linguistic accommodation among Urdu speakers in Karnataka.
9. LITERACY IN URDU POPULATED AREAS
Despite the progress of literacy programmes in India, there are more illiterate adults in India today than there were in 1951. However, we may not ignore the fact that the literacy rates in the country have shown a steady increase of about eight percent every decade since 1951, from a national average of 19.74% in 1951.
The literacy level is linked with the urban/rural factor in a significant way. A good number of people with no literacy live in the rural areas. They have no access to information through the written word. According to the 1991 census, 74.30 per cent of the total Indian population lives in the rural areas, and 25.7 per cent in urban areas. On the other hand, the literacy rate in urban areas is 61.72 while, in the rural areas, it is only 36.31 per cent.
The male/female parameter is also very significant in literacy. Males show higher literacy rate than females.
The table given below presents the figures of literacy among Urdu population in Karnataka.
Table 7: Literacy in Urdu Populated Areas
| S. No. | Districts | Total Population | Total Literates | Male | Female | Rural | Urban |
| 1. | Banglore | 48.4 Lacs | 31.6 Lacs(65.3%) | 18.1Lacs(57.3%) | 13.5 Lacs(42.6%) | 3.2 Lacs(10.0%) | 28.4 Lacs(89.9%) |
| 2. | Bellary | 18.9 Lacs | 4.9 Lacs (26.1%) | 4.5 Lacs(92.0%) | 2.4 Lacs(48.4%) | 2.1 Lacs(42.0%) | 2.9 Lacs(57.9%) |
| 3. | Bidar | 12.6 Lacs | 4.5 Lacs(35.9%) | 3.0 Lacs(67.0%) | 1.5 Lacs(32.9%) | 3.2 Lacs(70.0%) | 1.4 Lacs(29.9%) |
| 4. | Bijapur | 29.3 Lacs | 13.1 Lacs(44.6%) | 8.4 Lacs(64.3%) | 4.7 Lacs(35.7%) | 9.2 Lacs(70.0%) | 3.9 Lacs(29.9%) |
| 5. | Dharwad | 35.0 Lacs | 17.0 Lacs(48.5%) | 10.6 Lacs(62.6%) | 6.3 Lacs(37.3%) | 9.8 Lacs(57.5%) | 7.2 Lacs(42.4%) |
| 6. | Gulbarga | 25.8 Lacs | 7.9 Lacs(30.6%) | 5.4 Lacs(68.8%) | 2.5 Lacs(31.1%) | 4.7 Lacs(59.7%) | 3.2 Lacs(40.2%) |
| 7. | Kolar | 22.2 Lacs | 9.4 Lacs (42.3%) | 5.9 Lacs(63.2%) | 3.4 Lacs(36.7%) | 6.1 Lacs(65.3%) | 3.3 Lacs(34.6%) |
| 8. | Raichur | 23.1 Lacs | 6.6 Lacs(28.5%) | 4.6 Lacs(69.4%) | 2.0 Lacs(30.5%) | 4.4 Lacs(66.5%) | 2.2 Lacs(33.4%) |
| 9. | Shimoga | 19.1 Lacs | 9.9 Lacs(52.0%) | 5.9 Lacs(59.0%) | 4.1 Lacs(40.9%) | 6.6 Lacs(65.9%) | 3.4 Lacs(34.0%) |
| 10 | Uttara Kannada | 12.2 Lacs | 6.9 Lacs(56.4%) | 4.0 Lacs(58.1%) | 2.9 Lacs(41.8%) | 4.8 Lacs(70.3%) | 2.0 Lacs(29.6%) |
Chart 4: Total Population and Total Literates in Urdu Populated Areas
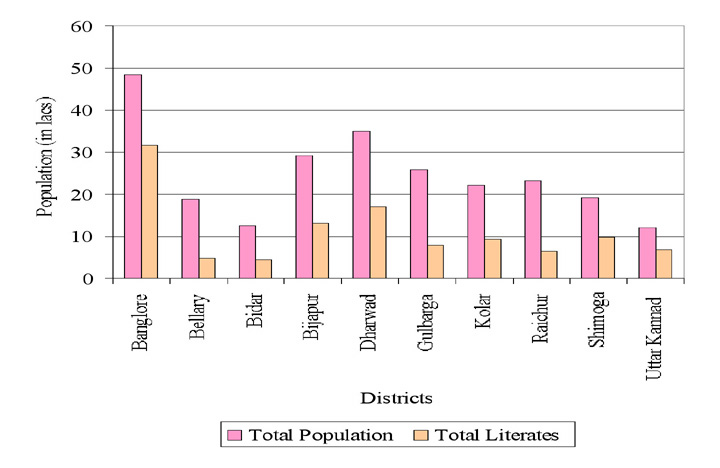
The table presented above indicates that the language issue is interlinked to the urban and rural factor in a significant way. The rural districts of Karnataka show high degree of illiteracy in comparison to urban centers.
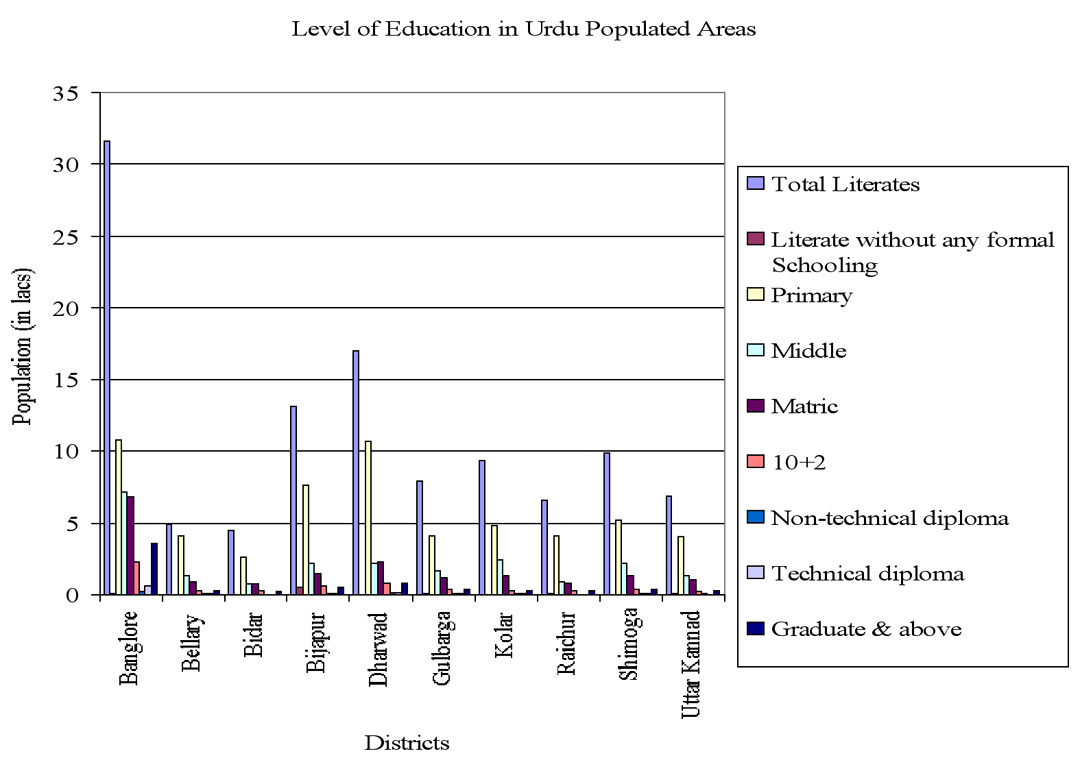
10. LEVEL OF EDUCATION AMONG URDU POPULATION
In late nineties India adopted a series of policies and programmes to improve its quantity and quality of education system. These included the approval and adoption of the policy called EDUCATION FOR ALL. In particular, this policy aimed at improving Primary education especially in rural areas.
In response to widespread concerns over the deteriorating standards of education on the one hand and the importance of education for national development and global participation, the need to strengthen the educational system has been recognised by the Ministry of Human Resource Development.
The table given below presents the level of education in Urdu populated areas of the state.
Table 8: Level of Education among Urdu Population
| Districts | Total Literates | Literate without any formal Schooling | Primary | Middle | Matric | 10+2 | Non-technical diploma | Technical diploma | Graduate & above |
| Banglore | 31.6 Lacs | 0.06 Lacs(0.1%) | 10.8 Lacs(34.3%) | 7.2 Lacs(22.6%) | 6.8 Lacs(21.5%) | 2.3 Lacs(7.2%) | 0.19 Lacs(0.6%) | 0.62 Lacs(1.9%) | 3.6 Lacs(11.4%) |
| Bellary | 4.9 Lacs | 0.03 Lacs (0.6%) | 4.1 Lacs(82.9%) | 1.3 Lacs(25.5%) | 0.9 Lacs(17.2%) | 0.3 Lacs(6.0%) | 0.06 Lacs(1.1%) | 0.04 Lacs(0.8%) | 0.3 Lacs(6.1%) |
| Bidar | 4.5 Lacs | 0.02 Lacs(0.4%) | 2.6 Lacs(58.7%) | 0.7 Lacs(15.6%) | 0.7 Lacs(14.7%) | 0.3 Lacs(5.6%) | 0.02 Lacs(0.5%) | 0.02 Lacs(0.4%) | 0.2 Lacs(3.8%) |
| Bijapur | 13.1 Lacs | 0.49 Lacs(3.7%) | 7.6 Lacs(58.1%) | 2.2 Lacs(17.0%) | 1.5 Lacs(11.8%) | 0.6 Lacs(4.4%) | 0.10 Lacs(0.7%) | 0.05 Lacs(0.4%) | 0.5 Lacs(3.6%) |
| Dharwad | 17.0 Lacs | 0.03 Lacs(0.1%) | 10.7 Lacs(62.8%) | 2.2 Lacs(13.2%) | 2.3 Lacs(13.2%) | 0.8 Lacs(4.6%) | 0.12 Lacs(0.7%) | 0.11 Lacs(0.6%) | 0.8 Lacs(4.5%) |
| Gulbarga | 7.9 Lacs | 0.04 Lacs(0.5%) | 4.1 Lacs(51.4%) | 1.7 Lacs(21.2%) | 1.2 Lacs(15.6%) | 0.4 Lacs(5.4%) | 0.05 Lacs(0.6%) | 0.05 Lacs(0.5%) | 0.4 Lacs(4.5%) |
| Kolar | 9.4 Lacs | 0.03 Lacs(0.3%) | 4.8 Lacs(50.7%) | 2.4 Lacs(25.9%) | 1.3 Lacs(14.3%) | 0.3 Lacs(3.6%) | 0.09 Lacs(0.9%) | 0.08 Lacs(0.8%) | 0.3 Lacs(3.1%) |
| Raichur | 6.6 Lacs | 0.08 Lacs(1.2%) | 4.1 Lacs(62.6%) | 0.9 Lacs(14.3%) | 0.8 Lacs(12.5%) | 0.3 Lacs(4.3%) | 0.03 Lacs(0.5%) | 0.03 Lacs(0.4%) | 0.3 Lacs(3.8%) |
| Shimoga | 9.9 Lacs | 0.02 Lacs(0.1%) | 5.2 Lacs(52.2%) | 2.2 Lacs(22.2%) | 1.3 Lacs(13.3%) | 0.4 Lacs(4.4%) | 0.08 Lacs(0.8%) | 0.06 Lacs(0.5%) | 0.4 Lacs(4.1%) |
| Uttara Kannada | 6.9 Lacs | 0.04 Lacs(0.5%) | 4.0 Lacs(58.1%) | 1.3 Lacs(18.5%) | 1.0 Lacs(13.8%) | 0.2 Lacs(3.4%) | 0.2 Lacs(3.4%) | 0.02 Lacs(0.3%) | 0.3 Lacs(4.3%) |
11. MEDIUM OF INSTRUCTION
- Kannada and English are generally the media of instruction.
- In Karnataka instruction is given through mother tongue at the Primary stage of education, provided a minimum of 10 students each in classes V to VII or 30 students in a school desire so.
- Urdu, Marathi, Telugu, Tamil, Malayalam, Gujarati, and Hindi are actually the recognised media of instruction.
- Kannada is taught in all the schools from V standard onwards. However, option is available to study it from standard III as well.
- Exemption from studying Kannada as a compulsory subject is available to those students whose parents come to the State on temporary transfer.
- There are 40,768 Primary schools in the State.
Table 9: Total Number of Languages used as Medium of Instruction in Karnataka
| Primary | Upper Primary | Secondary | Higher Secondary | |
| NCERT Third Survey | 8 | 8 | 7 | 5 |
| NCERT Fifth Survey | 8 | 8 | 7 | 6 |
The three-language formula adopted by the State entails the study of languages as under:
- Kannada, Urdu, Telugu, Tamil, Marathi, Hindi, English or Malayalam as the first language.
- Kannada, Tamil, Telugu, Malayalam, Marathi, Hindi, Urdu or English as the second language.
- Kannada, Tamil, Telugu, Marathi, Hindi, Malayalam, Urdu, English, Sanskrit, Arabic or Persian as the third language.
12. CONCLUSION
A very significant aspect of the Urdu speaking population in Karnataka is that a significant majority of this group is bilingual, adapting to the use of Kannada, the predominant language of the state. Another significant aspect is that Urdu is used by a good number of people who may not be Muslims. Thirdly, the Urdu populated districts show considerable variation in their literacy rates both for men and women. The lower literacy rates of these districts may be a consequence of low literacy rates among the Urdu speakers. However, this cannot be conclusively proved because of the lack of data. On the other hand, low percentage levels of education posted for the Urdu speaking population indirectly support this view. The situation calls for greater efforts on the part of the state government and non-governmental organizations to improve the communication efficiency of the Urdu speaking population not only in their mother tongue but also in the dominant language of the state, namely, Kannada. The literacy rate and the quality of literacy among the Urdu speakers call for improvement through more intensive efforts. For a meaningful participation in the socio-economic life of the state the educational levels of Urdu speakers need to be improved.
HOME PAGE | BACK ISSUES | Urdu in Karnataka | Bishnupriya Manipuri: A Brief Introduction |Language Policy For Education In Indian States: Karnataka | 20th Century Language Visionaries | Endangered Language: A Case Study of Sansiboli | CONTACT EDITOR
A. R. Fatihi, Ph.D.
Visiting Senior Faculty
Cornell University
E-mail: arf26@cornell.edu